|
Expansion of Hong
Kong |
|
Construction Phase Quarterly EM&A Report No.18 (1 April to 30 June 2020) |
|
|
||||
Contents
|
3RS |
Three-Runway System |
|
AAHK |
Airport Authority Hong Kong |
|
AECOM |
AECOM Asia Company Limited |
|
AFCD |
Agriculture, Fisheries and Conservation Department |
|
AIS |
Automatic Information System |
|
ANI |
Encounter Rate of Number of Dolphins |
|
APM |
Automated People Mover |
|
AW |
Airport West |
|
BHS |
Baggage Handling System |
|
CAP |
Contamination Assessment Plan |
|
CAR |
Contamination Assessment Report |
|
CWD |
Chinese White Dolphin |
|
DCM |
Deep Cement Mixing |
|
DEZ |
Dolphin Exclusion Zone |
|
DO |
Dissolved Oxygen |
|
EAR |
Ecological Acoustic Recorder |
|
EIA |
Environmental Impact Assessment |
|
EM&A |
Environmental Monitoring & Audit |
|
EMIS |
Environmental Mitigation Implementation Schedule |
|
EP |
Environmental Permit |
|
EPD |
Environmental Protection Department |
|
ET |
Environmental Team |
|
FCZ |
Fish Culture Zone |
|
HKBCF |
Hong Kong-Zhuhai-Macao Bridge Hong Kong Boundary Crossing Facilities |
|
HKIA |
Hong Kong International Airport |
|
HSF |
High Speed Ferry |
|
IEC |
Independent Environmental Checker |
|
LKC |
Lung Kwu Chau |
|
MTCC |
Marine Traffic Control Centre |
|
MMHK |
Mott MacDonald Hong Kong Limited |
|
MMWP |
Marine Mammal Watching Plan |
|
MSS |
Maritime Surveillance System |
|
MTRMP-CAV |
Updated Marine Travel Routes and Management Plan for Construction and Associated Vessel |
|
NEL |
Northeast Lantau |
|
NWL |
Northwest Lantau |
|
PAM |
Passive Acoustic Monitoring |
|
SC |
Sha Chau |
|
SCZ |
Speed Control Zone |
|
SCLKCMP |
Sha Chau and Lung Kwu Chau Marine Park |
|
SS |
Suspended Solids |
|
STG |
Encounter Rate of Number of Dolphin Sightings |
|
SWL |
Southwest Lantau |
|
The Manual |
The Updated EM&A Manual |
|
The Project |
The Expansion of Hong Kong International Airport into a Three-Runway System |
|
The SkyPier Plan |
Marine Travel Routes and Management Plan for High Speed Ferries of SkyPier |
|
TSP |
Total Suspended Particulates |
|
WL |
West Lantau |
|
WMP |
Waste Management Plan |
Executive Summary
The “Expansion of Hong Kong International Airport into a Three-Runway System” (the Project) serves to meet the future air traffic demands at Hong Kong International Airport (HKIA). On 7 November 2014, the Environmental Impact Assessment (EIA) Report (Register No.: AEIAR-185/2014) for the Project was approved and an Environmental Permit (EP) (Permit No.: EP-489/2014) was issued for the construction and operation of the Project.
Airport Authority Hong Kong (AAHK) commissioned Mott MacDonald Hong Kong Limited (MMHK) to undertake the role of Environmental Team (ET) for carrying out the Environmental Monitoring & Audit (EM&A) works during the construction phase of the Project in accordance with the Updated EM&A Manual (the Manual).
This is the 18th Construction Phase Quarterly EM&A Report for the Project which summarises the monitoring results and audit findings of the EM&A programme during the reporting period from 1 April 2020 to 30 June 2020.
Key Activities in the Reporting Period
EM&A Activities Conducted in the Reporting Period
The EM&A programme was undertaken in accordance with the Manual of the Project. Summary of the monitoring activities during this reporting period is presented as below:
|
Monitoring Activities |
Number of Sessions |
|
1-hour Total Suspended Particulates (TSP) air quality monitoring |
96 |
|
Noise monitoring |
56 |
|
Water quality monitoring |
39 |
|
Vessel line-transect surveys for Chinese White Dolphin (CWD) monitoring |
6 |
|
Land-based theodolite tracking survey effort for CWD monitoring |
6 |
Environmental auditing works, including weekly site inspections of construction works conducted by the ET and bi-weekly site inspections conducted by the Independent Environmental Checker (IEC), audit of SkyPier High Speed Ferries (HSF), audit of construction and associated vessels, and audit of implementation of Marine Mammal Watching Plan (MMWP) and Dolphin Exclusion Zone (DEZ) Plan, were conducted in the reporting period. Based on information including ET’s observations, records of Maritime Surveillance System (MSS), and contractors’ site records, it is noted that environmental pollution control and mitigation measures were properly implemented and construction activities of the Project in the reporting period did not introduce adverse impacts to the sensitive receivers.
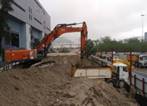
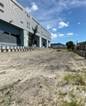
Snapshots of Good Environmental Practices in the Reporting Period
|
|
|
|
|
Reuse of inert C&D materials as filling materials for the marine reclamation |
Reuse of rubble and asphalt generated from demolition for paving haul roads |
Seawall blocks with eco-enhancement designs along the artificial vertical seawall |
Key examples of good site practices implemented in the Project are highlighted as below:
1. About 14,000 tonnes of inert C&D materials arising from the Horizontal Directional Drilling (HDD) works were reused as filling materials for the marine reclamation.
2. Rubble and asphalt collected from demolition were reused for paving haul roads of the construction area to reduce generation of fugitive dust during the movements of vehicle.
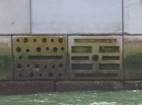
3. As part of the marine ecological and fisheries enhancement strategies, seawall blocks with eco-enhancement designs along the artificial vertical seawall has been installed to facilitate and promote colonisation of intertidal and sub-tidal fauna in the future.
Summary Findings of the EM&A Programme
The monitoring works for construction dust, construction noise, water quality, construction waste, landscape & visual, and CWD were conducted during the reporting period in accordance with the Manual.
Monitoring results of construction dust, construction noise, construction waste, and CWD monitoring did not trigger the corresponding Action and Limit Levels in the reporting period.
The water quality monitoring results for all parameters,
except dissolved oxygen (DO) and suspended solids (SS), obtained during the
reporting period were within the corresponding Action and Limit Levels
stipulated in the EM&A programme. Relevant investigation and follow-up
actions will be conducted according to the EM&A programme if the
corresponding Action and Limit Levels are triggered. For DO and SS, some
testing results triggered the relevant Action or Limit Level, and the
corresponding investigations were conducted accordingly. The investigation
findings concluded that the case was not related to the Project. To conclude,
the construction activities in the reporting period did not introduce adverse
impact to all water quality sensitive receivers.
The key findings of the EM&A programme during the reporting period is summarised as below:
|
|
Yes |
No |
Details |
Analysis / Recommendation / Remedial Actions |
|
Breach of Limit Level^ |
|
√ |
No breach of Limit Level was recorded. |
Nil |
|
Breach of Action Level^ |
|
√ |
No breach of Action Level was recorded. |
Nil |
|
Complaints Received |
|
√ |
No construction activities-related complaint was received |
Nil |
|
Notification of any summons and status of prosecutions |
|
√ |
No notification of summons or prosecution were received. |
Nil |
|
Changes that affect the EM&A |
|
√ |
There was no change to the construction works that may affect the EM&A. |
Nil |
Remarks:
^Only triggering of Action or Limit Level found related to Project works is counted as Breach of Action or Limit Level.
1
Introduction
1.1
Background
On 7 November 2014, the Environmental Impact Assessment (EIA) Report (Register No.: AEIAR-185/2014) for the “Expansion of Hong Kong International Airport into a Three-Runway System” (the Project) was approved and an Environmental Permit (EP) (Permit No.: EP-489/2014) was issued for the construction and operation of the Project.
Airport Authority Hong Kong (AAHK) commissioned Mott MacDonald Hong Kong Limited (MMHK) to undertake the role of Environmental Team (ET) for carrying out the Environmental Monitoring & Audit (EM&A) works during the construction phase of the Project in accordance with the Updated EM&A Manual (the Manual) submitted under EP Condition 3.1[1]. AECOM Asia Company Limited (AECOM) was employed by AAHK as the Independent Environmental Checker (IEC) for the Project.
The Project covers the expansion of the existing airport into a three-runway system (3RS) with key project components comprising land formation of about 650 ha and all associated facilities and infrastructure including taxiways, aprons, aircraft stands, a passenger concourse, an expanded Terminal 2, all related airside and landside works and associated ancillary and supporting facilities. The submarine aviation fuel pipelines and submarine power cables also require diversion as part of the works.
Construction of the Project is to proceed in the general order of diversion of the submarine aviation fuel pipelines, diversion of the submarine power cables, land formation, and construction of infrastructure, followed by construction of superstructures.
The updated overall phasing programme of all construction works was presented in Appendix A of the Construction Phase Monthly EM&A Report No. 7 and the contract information was presented in Appendix A of the Construction Phase Monthly EM&A Report No. 54.
1.2
Scope of this Report
This is the 18th Construction Phase Quarterly EM&A Report for the Project which summarises the key findings of the EM&A programme during the reporting period from 1 April 2020 to 30 June 2020.
1.3
Project Organisation
The Project’s organisation structure is provided in Appendix A. Contact details of the key personnel have been updated and provided in Table 1.1.
Table 1.1: Contact Information of Key Personnel
|
Party |
Position |
Name |
Telephone |
|
Project Manager’s Representative (Airport Authority Hong Kong) |
Principal Manager, Environment |
Lawrence Tsui |
2183 2734 |
|
Environmental Team (ET) (Mott MacDonald Hong Kong Limited) |
Environmental Team Leader |
Terence Kong |
2828 5919 |
|
Deputy Environmental Team Leader |
Heidi Yu |
2828 5704 |
|
|
Deputy Environmental Team Leader |
Daniel Sum |
2585 8495 |
|
|
Independent Environmental Checker (IEC) (AECOM Asia Company Limited) |
Independent Environmental Checker |
Jackel Law |
3922 9376
|
|
Deputy Independent Environmental Checker |
Roy Man |
3922 9141
|
Advanced Works:
|
Party |
Position |
Name |
Telephone |
|
Contract P560(R) Aviation Fuel Pipeline Diversion Works (Langfang Huayuan Mechanical and Electrical Engineering Co., Ltd.) |
Project Manager
|
Wei Shih
|
2117 0566
|
|
Environmental Officer |
Lyn Liu
|
5172 6543
|
Reclamation Works:
|
Party |
Position |
Name |
Telephone |
|
Contract 3205 DCM (Package 5) (Bachy Soletanche - Sambo Joint Venture) |
Deputy Project Director |
Min Park |
9683 0765 |
|
Environmental Officer |
William Chan |
5408 3045 |
|
|
Contract 3206 Main Reclamation Works (ZHEC-CCCC-CDC Joint Venture) |
Project Manager |
Alan Mong |
3763 1352
|
|
Environmental Officer |
Kwai Fung Wong |
3763 1452 |
Airfield Works:
|
Party |
Position |
Name |
Telephone |
|
Contract 3301 North Runway Crossover Taxiway (FJT-CHEC-ZHEC Joint Venture) |
Deputy Project Director |
Kin Hang Chung |
9800 0048 |
|
Environmental Officer |
Joe Wong |
6182 0351 |
|
|
Contract 3302 Eastern Vehicular Tunnel Advance Works (China Road and Bridge Corporation) |
Project Manager |
Dickey Yau |
5699 4503 |
|
Environmental Officer |
Dennis Ho |
5645 0563 |
|
|
Contract 3303 Third Runway and Associated Works (SAPR Joint Venture) |
Project Manager |
Andrew Keung |
6277 6628 |
|
Environmental Officer |
Max Chin |
6447 5707 |
|
|
Contract 3307 Fire Training Facility (Paul Y. Construction Company Limited) |
Project Manager |
Steven Meredith |
6109 1813 |
|
Environmental Officer |
Albert Chan |
9700 1083 |
Third Runway Concourse:
|
Party |
Position |
Name |
Telephone |
|
Contract 3402 New Integrated Airport Centres Enabling Works (Wing Hing Construction Co., Ltd.) |
Contract Manager |
Michael Kan |
9206 0550 |
|
Environmental Officer |
Lisa He |
5374 3418 |
|
|
Contract 3403 New Integrated Airport Centres Building and Civil Works (Sun Fook Kong Construction Limited) |
Project Manager |
Alice Leung |
9220 3162 |
|
Environmental Officer |
Alpha Chia |
9626 1114 |
|
|
Contract 3405 Third Runway Concourse Foundation and Substructure Works (China Road and Bridge Corporation – Bachy Soletanche Group Limited – LT Sambo Co., Ltd. Joint Venture) |
Project Manager |
Francis Choi |
9423 3469 |
|
Environmental Officer |
Cecilia Choi |
9265 9352 |
Terminal 2 (T2) Expansion:
|
Party |
Position |
Name |
Telephone |
|
Contract 3501 Antenna Farm and Sewage Pumping Station (Build King Construction Ltd.) |
Contracts Manager
|
Vincent Kwan
|
9833 1313
|
|
Environmental Officer |
Edward Tam |
9287 8270 |
|
|
Contract 3503 Terminal 2 Foundation and Substructure Works (Leighton – Chun Wo Joint Venture) |
Project Manager |
Eric Wu |
3973 1718 |
|
Environmental Officer |
Malcolm Leung |
3973 0850 |
Automated People Mover (APM) and Baggage Handling System (BHS):
|
Party |
Position |
Name |
Telephone |
|
Contract 3601 New Automated People Mover System (TRC Line) (CRRC Puzhen Bombardier Transportation Systems Limited and CRRC Nanjing Puzhen Co., Ltd. Joint Venture) |
Project Manager |
Hongdan Wei |
158 6180 9450 |
|
Environmental Officer |
K F Li |
9086 1793 |
|
|
Contract 3602 Existing APM System Modification Works (Niigata Transys Co., Ltd.) |
Project Manager |
Kunihiro Tatecho |
9755 0351 |
|
Environmental Officer |
Yolanda Gao |
5399 3509 |
|
|
Contract 3603 3RS Baggage Handling System (VISH Consortium) |
Project Manager |
K C Ho |
9272 9626 |
|
Environmental Officer |
Eric Ha |
9215 3432 |
Construction Support (Facilities):
|
Party |
Position |
Name |
Telephone |
|
Contract 3721 Construction Support Infrastructure Works (China State Construction Engineering (Hong Kong) Ltd.) |
Site Agent |
Thomas Lui |
9011 5340 |
|
Environmental Officer |
Xavier Lam |
9493 2944 |
|
|
Contract 3722 Western Support Area – Construction Support Facilities (Tapbo Construction Company Limited and Konwo Modular House Limited Joint Venture) |
Deputy Project Director |
Philip Kong |
9049 3161 |
|
Environmental Officer |
Sampson Lo |
9752 9118 |
Airport Support Infrastructure:
|
Party |
Position |
Name |
Telephone |
|
Contract 3801 APM and BHS Tunnels on Existing Airport Island (China State Construction Engineering (Hong Kong) Ltd.) |
Project Manager |
Tony Wong |
9642 8672 |
|
Environmental Officer |
Federick Wong |
9842 2703 |
|
|
Contract 3802 APM and BHS Tunnels and Related Works (Gammon Construction Limited) |
Project Director |
John Adams |
6111 6989 |
|
Environmental Officer |
Andy Leung |
9489 0035 |
Construction Support (Services / Licences):
|
Party |
Position |
Name |
Telephone |
|
Contract 3901A Concrete Batching Facility (K. Wah Concrete Company Limited) |
Project Manager |
Benedict Wong |
9553 2806 |
|
Environmental Officer |
C P Fung |
9874 2872 |
|
|
Contract 3901B Concrete Batching Facility (Gammon Construction Limited) |
Senior Project Manager |
Gabriel Chan |
2435 3260 |
|
Environmental Officer |
Rex Wong |
2695 6319 |
1.4
Contact information for the Project
The
contact information for the Project is provided in Table
1.2. The public can contact us through the following channels if
they have any queries and comments on the environmental monitoring data and
project related information.
Table 1.2: Contact Information of the Project
|
Channels |
Contact Information |
|
Hotline |
3908 0354 |
|
|
|
|
Fax |
3747 6050 |
|
Postal Address |
Airport Authority Hong Kong HKIA Tower 1 Sky Plaza Road Hong Kong International Airport Lantau Hong Kong Attn: Environmental Team Leader Mr Terence Kong c/o Mr Lawrence Tsui (TRD) |
1.5
Summary of Construction Works
The key activities of the Project carried out in the reporting period included reclamation works and land-based works. Works in the reclamation areas included DCM works, marine filling, seawall and facilities construction, together with runway and associated works. Land-based works on existing airport island involved mainly airfield works, foundation and substructure work for Terminal 2 expansion, modification and tunnel work for APM and BHS systems, and preparation work for utilities, with activities include site establishment, site office construction, road and drainage works, cable ducting, demolition of existing facilities, piling, and excavation works.
The locations of the key construction activities are presented in Figure 1.1.
1.6
Summary of EM&A Programme Requirements
The status for all environmental aspects is presented in Table 1.3. The EM&A requirements remained unchanged during the reporting period.
Table 1.3: Summary of Status for All Environmental Aspects under the Updated EM&A Manual
|
Parameters |
EM&A Requirements |
Status |
|
Air Quality |
|
|
|
Baseline Monitoring |
At least 14 consecutive days before commencement of construction work |
The baseline air quality monitoring result has been reported in Baseline Monitoring Report and submitted to EPD under EP Condition 3.4. |
|
Impact Monitoring |
At least 3 times every 6 days |
On-going |
|
Noise |
|
|
|
Baseline Monitoring |
Daily for a period of at least two weeks prior to the commencement of construction works |
The baseline noise monitoring result has been reported in Baseline Monitoring Report and submitted to EPD under EP Condition 3.4. |
|
Impact Monitoring |
Weekly |
On-going |
|
Water Quality |
|
|
|
General Baseline Water Quality Monitoring for reclamation, water jetting and field joint works |
Three days per week, at mid-flood and mid-ebb tides, for at least four weeks prior to the commencement of marine works. |
The baseline water quality monitoring result has been reported in Baseline Water Quality Monitoring Report and submitted to EPD under EP Condition 3.4. |
|
General Impact Water Quality Monitoring for reclamation, water jetting and field joint works |
Three days per week, at mid-flood and mid-ebb tides. |
On-going |
|
Initial Intensive Deep Cement Mixing (DCM) Water Quality Monitoring |
At least four weeks |
The Initial Intensive DCM Monitoring Report was submitted and approved by EPD in accordance with the Detailed Plan on DCM. |
|
Regular DCM Water Quality Monitoring |
Three times per week until completion of DCM works. |
On-going |
|
Waste Management |
|
|
|
Waste Monitoring |
At least weekly |
On-going |
|
Land Contamination |
|
|
|
Supplementary Contamination Assessment Plan (CAP) |
At least 3 months before commencement of any soil remediation works. |
The Supplementary CAP was submitted and approved by EPD pursuant to EP condition 2.20. |
|
Contamination Assessment Report (CAR) |
CAR to be submitted for golf course |
The CAR for Golf Course was submitted to EPD. |
|
CAR to be submitted for Terminal 2 Emergency Power Supply System No.1 (Volume 1) |
The CAR for Terminal 2 Emergency Power Supply System No.1 (Volumes 1 and 2) was submitted to EPD. |
|
|
Programme for submission of supplementary CAR at the other areas to be agreed. |
On-going |
|
|
Terrestrial Ecology |
|
|
|
Pre-construction Egretry Survey Plan |
Once per month in the breeding season between April and July, prior to the commencement of HDD drilling works. |
The Egretry Survey Plan was submitted and approved by EPD under EP Condition 2.14. |
|
Ecological Monitoring |
Monthly monitoring during the HDD construction works period from August to March. |
The terrestrial ecological monitoring at Sheung Sha Chau was completed in January 2019. |
|
Marine Ecology |
|
|
|
Pre-Construction Phase Coral Dive Survey |
Prior to marine construction works |
The Coral Translocation Plan was submitted and approved by EPD under EP Condition 2.12. |
|
Coral Translocation |
- |
The coral translocation was completed on 5 January 2017. |
|
Post-translocation Monitoring |
As per an enhanced monitoring programme based on the Coral Translocation Plan |
The post-translocation monitoring programme according to the Coral Translocation Plan was completed in April 2018. |
|
Chinese White Dolphins (CWD) |
|
|
|
Baseline Monitoring |
6 months of baseline surveys before the commencement of land formation related construction works. Vessel line transect surveys: Two full surveys per month; Land-based theodolite tracking surveys: Two days per month at the Sha Chau station and two days per month at the Lung Kwu Chau station; and Passive Acoustic Monitoring (PAM): For the whole duration of baseline period. |
Baseline CWD results were reported in the CWD Baseline Monitoring Report and submitted to EPD in accordance with EP Condition 3.4. |
|
Impact Monitoring |
Vessel line transect surveys: Two full surveys per month; Land-based theodolite tracking surveys: One day per month at the Sha Chau station and one day per month at the Lung Kwu Chau station; and PAM: For the whole duration for land formation related construction works. |
On-going |
|
Landscape and Visual |
|
|
|
Landscape and Visual Plan |
At least 3 months before the commencement of construction works on the formed land of the Project. |
The Landscape & Visual Plan was submitted to EPD under EP Condition 2.18 |
|
Baseline Monitoring |
One-off survey within the Project site boundary prior to commencement of any construction works |
The baseline landscape & visual monitoring result has been reported in Baseline Monitoring Report and submitted to EPD under EP Condition 3.4. |
|
Impact Monitoring |
Weekly |
On-going |
|
Environmental Auditing |
|
|
|
Regular site inspection |
Weekly |
On-going |
|
Marine Mammal Watching Plan (MMWP) implementation measures |
Monitor and check |
On-going |
|
Dolphin Exclusion Zone (DEZ) Plan implementation measures |
Monitor and check |
On-going |
|
SkyPier High Speed Ferries (HSF) implementation measures |
Monitor and check |
On-going |
|
Construction and Associated Vessels implementation measures |
Monitor and check |
On-going |
|
Complaint Hotline and Email Channel |
Construction phase |
On-going |
|
Environmental Log Book |
Construction phase |
On-going |
Taking into account the construction works in the reporting period, impact monitoring of air quality, noise, water quality, waste management, landscape & visual, and CWD were carried out in the reporting period.
The EM&A programme also involved weekly site inspections and related auditing conducted by ET for the checking of implementation of required environmental mitigation measures recommended in the approved EIA Report. To promote the environmental awareness and enhance the environmental performance of the contractors, environmental trainings and regular environmental management meetings were conducted during the reporting period which are summarised as below:
● Seven skipper trainings provided by ET;
● Four dolphin observer training session provided by ET;
● Two environmental briefings on EP and EM&A requirements of the 3RS provided by ET; and
● Thirty-nine environmental management meetings for EM&A review with works contracts.
The EM&A programme has been following the recommendations presented in the approved EIA Report and the Manual. A summary of implementation status of the environmental mitigation measures for the construction phase of the Project during the reporting period is provided in Appendix B.
2
Environmental Monitoring and
Auditing
2.1
Air Quality Monitoring
Impact 1-hour Total Suspended Particulates (TSP) monitoring was conducted three times every six days at two representative monitoring stations during the reporting period. The locations of monitoring stations are described in Table 2.1 and presented in Figure 2.1.
2.1.1
Action and Limit Levels
The Action and Limit Levels of the air quality monitoring stipulated in the EM&A programme for triggering the relevant investigation and follow-up procedures under the programme are provided in Table 2.1 for reference.
Table 2.1: Impact Air Quality Monitoring Stations
|
Monitoring Station |
Location |
Action Level (mg/m3) |
Limit Level (mg/m3) |
|
AR1A |
Man Tung Road Park |
306 |
500 |
|
AR2 |
Village House at Tin Sum |
298 |
2.1.2 Summary of Monitoring Results
The air quality monitoring results in the reporting
period are summarised in Table 2.2 and the graphical plot is presented in Appendix C.
Table 2.2: Percentage of Air Quality Monitoring Results within Action and Limit Levels
|
|
AR1A |
AR2 |
|
Mar 2020 |
100% |
100% |
|
Apr 2020 |
100% |
100% |
|
Jun 2020 |
100% |
100% |
|
Overall |
100% |
100% |
|
Note: The percentages are calculated by dividing the number of monitoring results within their corresponding Action and Limit Levels by the total number of monitoring results. |
||
All monitoring results were within their corresponding Action and Limit Levels at all monitoring stations in the reporting period.
General meteorological conditions in the last month of the previous quarter and this reporting period were recorded and summarised in Table 2.3.
Table 2.3: General Meteorological Condition during Impact Air Quality Monitoring
|
|
Weather |
Dominant Wind Direction |
|
Mar 2020 |
Sunny to Rainy |
East |
|
Apr 2020 |
Sunny to Cloudy |
West |
|
May 2020 |
Sunny to Cloudy |
Southwest |
|
Jun 2020 |
Sunny to Cloudy |
Southwest |
2.1.3
Conclusion
No dust emission source was observed at the monitoring stations during the monitoring sessions. As the sensitive receivers were far away from the construction activities, with the implementation of dust control measures, there was no adverse impact at the sensitive receivers attributable to the works of the Project.
2.2
Noise Monitoring
Impact noise monitoring was conducted at four representative monitoring stations once per week during 0700 and 1900 in the reporting period. The locations of monitoring stations are described in Table 2.4 and presented in Figure 2.1.
2.2.1
Action and Limit Levels
The Action and Limit Levels of the noise monitoring stipulated in the EM&A programme for triggering the relevant investigation and follow-up procedures under the programme are provided in Table 2.4 for reference.
Table 2.4: Impact Noise Monitoring Stations
|
Monitoring Station |
Location |
Action Level |
Limit Level |
|
NM1A |
Man Tung Road Park |
When one documented complaint is received from any one of the sensitive receivers |
75 dB(A) |
|
NM4 |
Ching Chung Hau Po Woon Primary School |
65dB(A) / 70 dB(A) (i) |
|
|
NM5 |
Village House in Tin Sum |
75 dB(A) |
|
|
NM6 |
House No. 1, Sha Lo Wan |
75 dB(A) |
|
|
Note: (i) The Limit Level for NM4 is reduced to 70dB(A) for being an educational institution. During school examination period, the Limit Level is further reduced to 65dB(A). |
|||
2.2.2
Summary of Monitoring Results
The noise monitoring results in the reporting period
are summarised in Table 2.5 and the
graphical plot is presented in Appendix C.
Table 2.5: Percentage of Noise Monitoring Results within Action and Limit Levels
|
|
NM1A |
NM4 |
NM5 |
NM6 |
|
Apr 2020 |
100% |
100% |
100% |
100% |
|
May 2020 |
100% |
100% |
100% |
100% |
|
Jun 2020 |
100% |
100% |
100% |
100% |
|
Overall |
100% |
100% |
100% |
100% |
|
Note: The percentages are calculated by dividing the number of monitoring results within their corresponding Action and Limit Levels by the total number of monitoring results. |
||||
No complaints were received from any sensitive receiver that triggered the Action Level. All monitoring results were also within the corresponding Limit Levels at all monitoring stations in the reporting period.
General meteorological conditions in the last month of the previous quarter and this reporting period were recorded and summarised in Table 2.6.
Table 2.6: General Meteorological Condition during Impact Noise Monitoring
|
|
Weather |
|
Mar 2020 |
Sunny to Drizzle |
|
Apr 2020 |
Sunny to Cloudy |
|
May 2020 |
Sunny to Cloudy |
|
Jun 2020 |
Sunny to Cloudy |
2.2.3
Conclusion
Major sources of noise dominating the monitoring stations observed during the construction noise impact monitoring were traffic noise near NM1A and aircraft noise near NM5, and NM6. As the sensitive receivers were far away from the construction activities, with the implementation of noise control measures, there was no adverse impact at the sensitive receivers attributable to the works of the Project.
2.3
Water Quality Monitoring
During the reporting period, water quality monitoring was conducted three days per week, at mid-flood and mid-ebb tides, at a total of 23 water quality monitoring stations, comprising 12 impact (IM) stations, 8 sensitive receiver (SR) stations, and 3 control (C) stations in the vicinity of the water quality sensitive receivers around the existing airport island in accordance with the Manual. The purpose of water quality monitoring at the IM stations is to promptly capture any potential water quality impacts from the Project before the impacts could become apparent at sensitive receivers (represented by the SR stations). Table 2.7 describes the details of the monitoring stations. Figure 2.2 shows the locations of the monitoring stations.
Table 2.7: Monitoring Locations and Parameters for Impact Water Quality Monitoring
|
Description |
Coordinates Easting Northing |
Parameters |
||
|
|
|
|||
|
C1 |
Control Station |
804247 |
815620 |
General Parameters DO, pH, Temperature, Salinity, Turbidity, SS
DCM Parameters Total Alkalinity, Heavy Metals(2) |
|
C2 |
Control Station |
806945 |
825682 |
|
|
C3(3) |
Control Station |
817803 |
822109 |
|
|
IM1 |
Impact Station |
807132 |
817949 |
|
|
IM2 |
Impact Station |
806166 |
818163 |
|
|
IM3 |
Impact Station |
805594 |
818784 |
|
|
IM4 |
Impact Station |
804607 |
819725 |
|
|
IM5 |
Impact Station |
804867 |
820735 |
|
|
IM6 |
Impact Station |
805828 |
821060 |
|
|
IM7 |
Impact Station |
806835 |
821349 |
|
|
IM8 |
Impact Station |
808140 |
821830 |
|
|
IM9 |
Impact Station |
808811 |
822094 |
|
|
IM10 |
Impact Station |
809794 |
822385 |
|
|
IM11 |
Impact Station |
811460 |
822057 |
|
|
IM12 |
Impact Station |
812046 |
821459 |
|
|
SR1A(1) |
Hong Kong-Zhuhai-Macao Bridge Hong Kong Boundary Crossing Facilities (HKBCF) Seawater Intake for cooling |
812660
|
819977 |
General Parameters DO, pH, Temperature, Salinity, Turbidity, SS |
|
SR2(3) |
Planned marine park / hard corals at The Brothers / Tai Mo To |
814166 |
821463 |
General Parameters DO, pH, Temperature, Salinity, Turbidity, SS
DCM Parameters Total Alkalinity, Heavy Metals(2)(4) |
|
SR3 |
Sha Chau and Lung Kwu Chau Marine Park / fishing and spawning grounds in North Lantau |
807571 |
822147 |
General Parameters DO, pH, Temperature, Salinity, Turbidity, SS
|
|
SR4A |
Sha Lo Wan |
807810 |
817189 |
|
|
SR5A |
San Tau Beach SSSI |
810696 |
816593 |
|
|
SR6A(5) |
Tai Ho Bay, Near Tai Ho Stream SSSI |
814739 |
817963 |
|
|
SR7 |
Ma Wan Fish Culture Zone (FCZ) |
823742 |
823636 |
|
|
SR8(6) |
Seawater Intake for cooling at Hong Kong International Airport (East) |
811623 |
820390 |
|
Notes:
(1) With the operation of HKBCF, water quality monitoring at SR1A station was commenced on 25 October 2018.
(2) Details of selection criteria for the two heavy metals for regular DCM monitoring refer to the Detailed Plan on Deep Cement Mixing available on the dedicated 3RS website (http://env.threerunwaysystem.com/en/ep-submissions.html). DCM specific water quality monitoring parameters (total alkalinity and heavy metals) were only conducted at C1 to C3, SR2, and IM1 to IM12.
(3) According to the Baseline Water Quality Monitoring Report, C3 station is not adequately representative as a control station of impact/ SR stations during the flood tide. The control reference has been changed from C3 to SR2 from 1 September 2016 onwards.
(4) Total alkalinity and heavy metals results are collected at SR2 as a control station for regular DCM monitoring.
(5) As the access to SR6 was obstructed by the construction activities and temporary structures for Tung Chung New Town Extension, the monitoring location has been relocated to SR6A starting from 8 August 2019.
(6) The monitoring location for SR8 is subject to further changes due to silt curtain arrangements and the progressive relocation of this seawater intake.
2.3.1 Action and Limit Levels
The Action and Limit Levels for general water quality monitoring and regular DCM monitoring stipulated in the EM&A programme for triggering the relevant investigation and follow-up procedures under the programme are presented in Table 2.8. The control and IM stations during flood tide and ebb tide for general water quality monitoring and regular DCM monitoring are presented in Table 2.9.
Table 2.8: Action and Limit Levels for General Water Quality Monitoring and Regular DCM Monitoring
|
Parameters |
Action Level |
Limit Level |
||
|
Action and Limit Levels for general water quality monitoring and regular DCM monitoring (excluding SR1A & SR8) |
||||
|
DO in mg/l (Surface, Middle & Bottom) |
Surface and Middle 4.5 mg/l |
Surface and Middle 4.1 mg/l 5 mg/l for Fish Culture Zone (SR7) only |
||
|
Bottom 3.4 mg/l |
Bottom 2.7 mg/l |
|||
|
SS in mg/l |
23 |
or 120% of upstream control station at the same tide of the same day, whichever is higher |
37 |
or 130% of upstream control station at the same tide of the same day, whichever is higher |
|
Turbidity in NTU |
22.6 |
36.1 |
||
|
Total Alkalinity in ppm |
95 |
99 |
||
|
Representative Heavy Metals for regular DCM monitoring (Chromium) |
0.2 |
0.2 |
||
|
Representative Heavy Metals for regular DCM monitoring (Nickel) |
3.2 |
|
3.6 |
|
|
Action and Limit Levels SR1A |
|
|
|
|
|
SS (mg/l) |
33 |
42 |
||
|
Action and Limit Levels SR8 |
|
|
|
|
|
SS (mg/l) |
52 |
|
60 |
|
Notes:
1. For DO measurement, Action or Limit Level is triggered when monitoring result is lower than the limits.
2. For parameters other than DO, Action or Limit Level of water quality results is triggered when monitoring results is higher than the limits.
3. Depth-averaged results are used unless specified otherwise.
4. Details of selection criteria for the two heavy metals for regular DCM monitoring refer to the Detailed Plan on Deep Cement Mixing available on the dedicated 3RS website http://env.threerunwaysystem.com/en/ep-submissions.html)
5. The Action and Limit Levels for the two representative heavy metals chosen will be the same as that for the intensive DCM monitoring.
Table 2.9: The Control and Impact Stations during Flood Tide and Ebb Tide for General Water Quality Monitoring and Regular DCM Monitoring
|
Control Station |
Impact Stations |
|
Flood Tide |
|
|
C1 |
IM1, IM2, IM3, IM4, IM5, IM6, IM7, IM8, SR3 |
|
SR21 |
IM7, IM8, IM9, IM10, IM11, IM12, SR1A, SR3, SR4A, SR5A, SR6A, SR8 |
|
Ebb Tide |
|
|
C1 |
SR4A, SR5A, SR6A |
|
C2 |
IM1, IM2, IM3, IM4, IM5, IM6, IM7, IM8, IM9, IM10, IM11, IM12, SR1A, SR2, SR3, SR7, SR8 |
Note:
1. As per findings of Baseline Water Quality Monitoring Report, the control reference has been changed from C3 to SR2 from 1 Sep 2016 onwards.
2.3.2
Summary of Monitoring Results
The
summary or results within their corresponding Action and Limit Levels in the
reporting period are presented in Table
2.10. The weather and sea conditions in the last month of the
previous quarter and this reporting period were recorded and summarised in Table 2.11.
Table 2.10 : Percentage of Water Quality Monitoring Results within Action and Limit Levels
|
|
General Water Quality Monitoring |
Regular DCM Monitoring |
|||||
|
DO (Surface and Middle) |
DO (Bottom) |
SS |
Turbidity |
Alkalinity |
Chromium |
Nickel |
|
|
Apr 2020 |
100% (455/455) |
100% (455/455) |
100% (507/507) |
100% (455/455) |
100% (312/312) |
100% (312/312) |
100% (312/312) |
|
May 2020 |
99.8% (437/438) |
100% (438/438) |
99.8% (487/488) |
100% (438/438) |
100% (300/300) |
100% (300/300) |
100% (300/300) |
|
Jun 2020 |
93.4% (425/455) |
91.6% (417/455) |
100% (507/507) |
100% (455/455) |
100% (312/312) |
100% (312/312) |
100% (312/312) |
|
Overall |
97.7% |
97.2% |
99.9% |
100% |
100% |
100% |
100% |
|
Note: The percentages are calculated by dividing the number of depth-averaged results complying with their corresponding Action and Limit Levels by the total number of depth-averaged results. |
|||||||
Table 2.11: General Weather Condition and Sea Condition during Impact Water Quality Monitoring
|
|
Weather |
Sea Condition |
|
Mar 2020 |
Sunny to Rainy |
Calm to Rough |
|
Apr 2020 |
Sunny to Rainy |
Calm to Rough |
|
May 2020 |
Sunny to Rainy |
Calm to Rough |
|
Jun 2020 |
Sunny to Rainy |
Calm to Rough |
The monitoring results for all parameters, except DO and SS, obtained during the reporting period were within their corresponding Action and Limit Levels stipulated in the EM&A programme. Relevant investigation and follow-up actions will be conducted according to the EM&A programme if the corresponding Action and Limit Levels are triggered.
For DO and SS, some of the testing results triggered the relevant Action or Limit Level in the reporting period, and investigations were conducted accordingly. Summaries of results triggering Action or Limit Level for DO and SS are presented Table 2.12 to Table 2.16.
Details of the investigation findings were presented in Construction Phase Monthly EM&A Report No. 52, 53, 54, and 55, which concluded that all results triggering the Action or Limit Level were not related to the Project.
Table 2.12: Summary of DO (Surface and Middle) Results triggering Action or Limit Level (Mid-Ebb Tide)
|
IM1 |
IM2 |
IM3 |
IM4 |
IM5 |
IM6 |
IM7 |
IM8 |
IM9 |
IM10 |
IM11 |
IM12 |
SR2 |
SR3 |
SR4A |
SR5A |
SR6A |
SR7 |
|
|
30/05/2020 |
|
|
|
|
|
|
|
|
|
|
|
|
|
|
|
|
|
D |
|
11/06/2020 |
|
D |
D |
D |
|
|
|
|
|
|
|
|
|
|
D |
|
|
|
|
13/06/2020 |
|
D |
D |
D |
|
|
|
|
|
|
|
|
|
|
D |
|
|
D |
|
16/06/2020 |
|
D |
D |
|
|
|
|
|
|
|
|
|
|
|
|
|
|
|
|
20/06/2020 |
|
|
D |
|
|
|
|
|
|
|
|
|
|
|
|
|
|
|
|
No. of result triggering Action or Limit Level |
0 |
3 |
4 |
2 |
2 |
2 |
2 |
1 |
0 |
0 |
0 |
0 |
0 |
2 |
2 |
0 |
0 |
2 |
Table 2.13: Summary of DO (Bottom) Results triggering Action or Limit Level (Mid-Ebb Tide)
|
IM1 |
IM2 |
IM3 |
IM4 |
IM5 |
IM6 |
IM7 |
IM8 |
IM9 |
IM10 |
IM11 |
IM12 |
SR2 |
SR3 |
SR4A |
SR5A |
SR6A |
SR7 |
|
|
11/06/2020 |
D |
D |
D |
D |
|
|
|
|
|
|
|
|
|
|
D |
|
|
|
|
13/06/2020 |
|
D |
D |
D |
|
|
|
|
|
|
|
|
|
|
D |
|
|
|
|
16/06/2020 |
|
D |
D |
D |
|
|
|
|
|
|
|
|
|
|
|
|
|
|
|
18/06/2020 |
|
D |
D |
D |
|
|
|
|
|
|
|
|
|
|
D |
|
|
|
|
20/06/2020 |
|
D |
D |
|
|
|
|
|
|
|
|
|
|
|
D |
|
|
|
|
23/06/2020 |
|
D |
D |
|
|
|
|
|
|
|
|
|
|
|
D |
|
|
|
|
25/06/2020 |
|
D |
|
|
|
|
|
|
|
|
|
|
|
|
D |
|
|
|
|
No. of result triggering Action or Limit Level |
1 |
7 |
6 |
4 |
1 |
1 |
1 |
0 |
0 |
0 |
0 |
0 |
0 |
0 |
6 |
0 |
0 |
0 |
Table 2.14: Summary of DO (Surface and Middle) Results triggering Action or Limit Level (Mid-Flood Tide)
|
IM1 |
IM2 |
IM3 |
IM4 |
IM5 |
IM6 |
IM7 |
IM8 |
IM9 |
IM10 |
IM11 |
IM12 |
SR3 |
SR4A |
SR5A |
SR6A |
SR7 |
|
|
11/06/2020 |
|
|
|
|
|
|
|
|
|
|
|
|
|
|
|
|
|
|
13/06/2020 |
|
|
|
|
D |
|
D |
|
|
|
|
|
D |
|
|
|
|
|
No. of result triggering Action or Limit Level |
0 |
2 |
2 |
2 |
1 |
0 |
1 |
0 |
0 |
0 |
0 |
0 |
1 |
0 |
0 |
0 |
0 |
Table 2.15: Summary of DO (Bottom) Results triggering Action or Limit Level (Mid-Flood Tide)
|
IM1 |
IM2 |
IM3 |
IM4 |
IM5 |
IM6 |
IM7 |
IM8 |
IM9 |
IM10 |
IM11 |
IM12 |
SR3 |
SR4A |
SR5A |
SR6A |
SR7 |
|
|
11/06/2020 |
|
|
|
|
|
|
D |
|
|
|
|
|
|
|
|
|
|
|
13/06/2020 |
|
|
|
|
D |
D |
D |
|
|
|
|
|
D |
|
|
|
|
|
16/06/2020 |
|
|
|
|
|
|
|
|
|
|
|
|
|
|
|
|
|
|
No. of result triggering Action or Limit Level |
0 |
1 |
2 |
1 |
1 |
1 |
2 |
0 |
0 |
0 |
0 |
0 |
1 |
2 |
0 |
0 |
0 |
Table 2.16: Summary of SS Results triggering Action or Limit Level (Mid-Flood Tide)
|
IM1 |
IM2 |
IM3 |
IM4 |
IM5 |
IM6 |
IM7 |
IM8 |
IM9 |
IM10 |
IM11 |
IM12 |
SR1A |
SR3 |
SR4A |
SR5A |
SR6A |
SR7 |
SR8 |
|
|
09/05/2020 |
|
|
|
|
D |
|
|
|
|
|
|
|
|
|
|
|
|
|
|
|
No. of result triggering Action or Limit Level |
0 |
0 |
0 |
0 |
1 |
0 |
0 |
0 |
0 |
0 |
0 |
0 |
0 |
0 |
0 |
0 |
0 |
0 |
0 |
Note: The monitoring results compiled with their corresponding Action or Limit Levels are presented in Appendix C.
|
Legend: |
|
|
|
Result within corresponding Action and Limit Levels |
|
|
Result triggered the Action Level at monitoring station located upstream of the Project based on dominant tidal flow |
|
D |
Result triggered the Action Level at monitoring station located downstream of the Project based on dominant tidal flow |
|
D |
Result triggered the Limit Level at monitoring station located downstream of the Project based on dominant tidal flow |
|
|
Upstream station with respect to the Project during the respective tide based on dominant tidal flow |
|
|
Downstream station with respect to the Project during the respective tide based on dominant tidal flow |
2.3.3 Conclusion
In the reporting period, it is noted that most monitoring results were within their corresponding Action and Limit Levels, while only a minor number of results triggered their corresponding Action or Limit Level, and investigations were conducted accordingly. Based on the findings presented in Construction Phase Monthly EM&A Report Nos. 52, 53, 54, and 55, all cases that triggered the corresponding Action or Limit Level were not related to the Project. Hence, the Project did not introduce adverse impact to all water quality sensitive receivers. All required actions under the Event and Action Plan were followed.
Nevertheless, the non-project related triggers were attended to and initiated corresponding action and measures. As part of the EM&A programme, the construction methods and mitigation measures for water quality will continue to be monitored and opportunities for further enhancement will continue to be explored and implemented where possible, to strive for better protection of water quality and the marine environment.
In the meantime, the contractors were reminded to implement and maintain all mitigation measures during weekly site inspections and regular environmental management meetings. These include maintaining mitigation measures properly for reclamation works including DCM works, marine filling, and seawall construction as recommended in the Manual.
2.4 Waste Monitoring
In accordance with the Manual, waste generated from construction activities was audited once per week to determine if wastes were being managed in accordance with the Waste Management Plan (WMP) prepared for the Project, contract-specific WMP, and any statutory and contractual requirements. All aspects of waste management including waste generation, storage, transportation, and disposal were assessed during the audits.
2.4.1
Action and Limit Levels
The Action and Limit Levels of the construction waste are provided in Table 2.17.
Table 2.17: Action and Limit Levels for Construction Waste
|
Monitoring Stations |
Action Level |
Limit Level |
|
Construction Area |
When one valid documented complaint is received |
Non-compliance of the WMP, contract-specific WMPs, any statutory and contractual requirements |
2.4.2
Summary of Monitoring Results
Weekly monitoring of the Project construction works was carried out by the ET in the reporting period to check and monitor the implementation of proper waste management practices.
Recommendations made by the ET included provision and maintenance of proper chemical waste storage area, as well as handling, segregation, and regular disposal of general refuse. The contractors had taken actions to implement the recommended measures. Waste management audits were carried out by ET according to the requirement of the Waste Management Plan, Updated EM&A Manual and the implementation schedule of the waste management mitigation measures in Appendix B.
Based on updated contractors’ information, summary of construction waste generated in the reporting period is presented in Table 2.18. Proactive measures have been undertaken during the re-configuration of T2 building. The contractor has established the recycling strategy for C&D materials with proper planning and design to maximize recycling and reuse. Dedicated recyclers were employed for different kinds of recyclable materials by the contractor, and ET and IEC have carried out site visit to recyclers’ facilities to review recycling process. Recycling materials before leaving the site are weighted by a weight bridge and monitored by CCTV system. Dedicated areas for sorting of materials are established on site. Recyclable materials such as steel, reinforcement bar, structural steel, aluminium, copper, other metals and glass are sorted on-site and transported off-site for recycling. ET and IEC has carried out site audits regularly and reviewed the trip ticket system.
Table 2.18: Construction Waste Statistics
|
|
C&D(1) Material Stockpiled for Reuse or Recycle (m3) |
C&D Material Reused in the Project (m3) |
C&D Material Reused in other Projects (m3) |
C&D Material Transferred to Public Fill(3) (m3) |
Chemical Waste (kg) |
Chemical Waste (l) |
General Refuse (tonne) |
|
|
Apr 2020(2) |
2,809 |
14,720 |
0 |
2,700 |
0 |
4,800 |
998 |
|
|
May 2020(2) |
3,424 |
39,321 |
0 |
2,871 |
60 |
2,000 |
1,131 |
|
|
Jun 2020(2) |
3,903 |
24,450 |
0 |
3,164 |
0 |
0 |
736 |
|
|
Total |
10,136 |
78,491 |
0 |
8,735 |
60 |
6,800 |
2,865 |
|
|
Notes: 1. C&D refers to Construction and Demolition. 2. Paper, metals and/or plastics were recycled in the reporting period. 3. C&D materials not suitable for reuse on-site, including asphalt waste and sediment slurry, were transferred to public fill during the reporting period. |
|
|||||||
There were no complaints, non-compliance of the WMP, contract-specific WMPs, statutory and contractual requirements that triggered Action and Limit Levels in the reporting period.
Marine Sediment Management
Marine sediment is managed according to the EIA Report, Updated EM&A Manual and the project Waste Management Plan. Sediment sampling and treatment are in progress. Treated sediment is reused as backfilling materials.
2.5
Chinese White Dolphin Monitoring
CWD monitoring was conducted by vessel line transect survey at a frequency of two full surveys per month, supplemented by land-based theodolite tracking survey and PAM. The frequency of the land-based theodolite tracking survey during the construction phase was one day per month at both Sha Chau (SC) and Lung Kwu Chau (LKC) stations, as stipulated in the Manual. The vessel survey transects followed the transect lines proposed in the Manual and are consistent with those used in the Agriculture, Fisheries and Conservation Department (AFCD) long-term CWD monitoring programme. The transect locations of CWD monitoring by vessel line transect survey conducted from April to June 2020 are shown in Figure 2.3, whilst the land-based theodolite tracking survey stations are described in Table 2.19 and depicted in Figure 2.4. The location of the PAM device is shown in Figure 2.10.
Table 2.19: Land-based Theodolite Tracking Survey Station Details
|
Stations |
Location |
Geographical Coordinates |
Station Height (m) |
Approximate Tracking Distance (km) |
|
D |
Sha Chau (SC) |
22° 20’ 43.5” N 113° 53’ 24.66” E |
45.66 |
2 |
|
E |
Lung Kwu Chau (LKC) |
22° 22’ 44.83” N 113° 53’ 0.2” E |
70.40 |
3 |
2.5.1
Action and Limit Levels
The Action Level and Limit Level for CWD monitoring were formulated by an action response approach using the running quarterly dolphin encounter rates (STG and ANI) derived from baseline monitoring data, as presented in the CWD Baseline Monitoring Report. The derived values of Action and Limit Levels for CWD monitoring are shown in Table 2.20.
Table 2.20: Derived Values of Action Level and Limit Level for Chinese White Dolphin Monitoring
|
|
NEL, NWL, AW, WL and SWL as a Whole |
|
Action Level |
Running quarterly STG < 1.86 & ANI < 9.35 |
|
Limit Level |
Two consecutive running quarterly (3-month) STG < 1.86 & ANI < 9.35 |
2.5.2
Summary
of Monitoring Results
2.5.2.1
Vessel Line Transect Survey
Survey Effort
During the April to June 2020 reporting period, a total of six sets of vessel line transect survey covering all transects in Northeast Lantau (NEL), Northwest Lantau (NWL), Airport West (AW), West Lantau (WL) and Southwest Lantau (SWL) survey areas were conducted at a frequency of twice per month, in each survey area.
A total of around 1,349 km of survey effort was collected from these surveys, with around 94.7% of the total survey effort being conducted under favourable weather condition (i.e. Beaufort Sea State 3 or below with favourable visibility). Details of the survey effort data are presented in Appendix C.
CWD Sighting
From April to June 2020, there were a total of 41 sightings of CWDs, with 178 dolphins sighted (Table 2.21). Amongst these sightings, 40 sightings with 177 dolphins were recorded during on-effort searches under favourable weather condition.
When breaking down the sightings by survey areas, 26 sightings with 121 dolphins and 15 sightings with 57 dolphins were recorded in WL and SWL survey areas respectively during the current reporting period. No CWD was sighted in NEL, NWL or AW survey areas.
Compared with the last quarter (i.e. January to March 2020), the total number of CWD sightings and the total number of dolphins increased by around 8% and 42% respectively. Both of WL and SWL showed increases in terms of both the number of CWD sightings and number of dolphins, and such increase was most remarkable for the number of dolphins in SWL (i.e. increased by 138%). In NWL (including AW transects), the number of CWD sightings dropped from five to zero.
Compared with the same quarter of last year in 2019 (i.e. April to June 2019), there is an overall observable increase in both number of CWD sightings and number of dolphins, by 17% and 32% respectively, although the number of CWD sighting in NWL dropped to zero in this year.
Table 2.21 below shows the comparison of the numbers of sightings and dolphins amongst the current reporting period, last quarter, and the same quarter of last year.
Table 2.21: Summary of Number of CWD Sightings and Number of Dolphins for the Same Quarter Last Year, Previous Quarter, and Current Reporting Period
|
|
Same Quarter of Last Year |
Previous Reporting Period |
Current Reporting Period |
|
|
April to June 2019 |
January to March 2020 |
April to June 2020 |
|
NEL |
0 (0) |
0 (0) |
0 (0) |
|
NWL |
9 (22) |
4 (16) |
0 (0) |
|
AW |
0 (0) |
1 (6) |
0 (0) |
|
WL |
20 (96) |
25 (79) |
26 (121) |
|
SWL |
6 (17) |
8 (24) |
15 (57) |
|
Total |
35 (135) |
38 (125) |
41 (178) |
Note: Values in ( ) represent number of dolphins
The distribution of CWD sightings recorded from
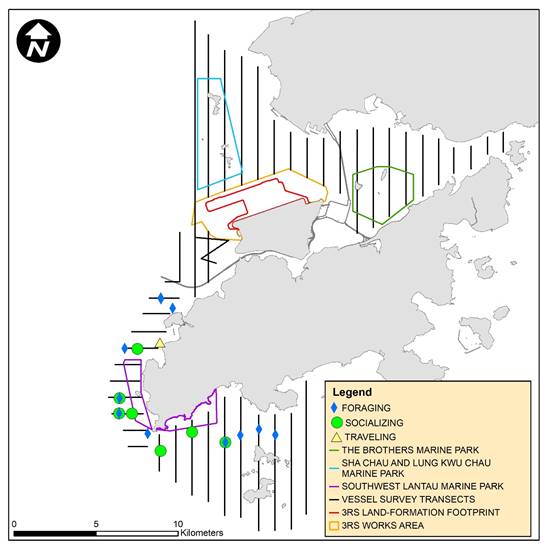
April to June 2020 is illustrated in Figure 2.5. In WL, CWD sightings mainly
clustered at waters between Tai O and Yi O, and also between Peaked Hill and
Fan Lau. In SWL, most of the CWD sightings scattered from Fan Lau to the waters
north of the Soko Islands. No CWD sightings were recorded in NEL, NWL or AW
survey areas. Details of the sighting data are presented in Appendix C.
Figure 2.5: Sightings Distribution of Chinese White Dolphins from April to June 2020
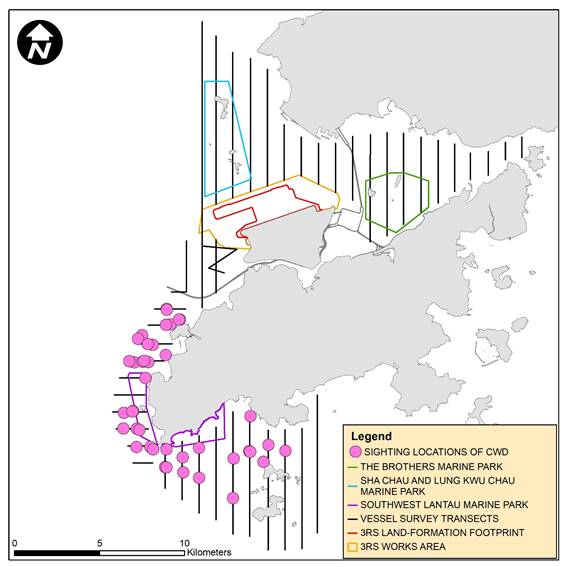
Remarks: (1) Please note that there are 41 pink circles on the map indicating the sighting locations of CWD. Some of them were very close to each other and therefore appear overlapped on this sighting distribution map. (2) Marine park excludes land area and the landward boundary generally follows the high water mark along the coastline.
Encounter Rate
The dolphin encounter rates for the number of on-effort dolphin sightings per 100 km survey effort (STG) and for the total on-effort number of dolphins per 100 km survey effort (ANI) in the whole survey area (i.e. NEL, NWL, AW, WL and SWL) for April, May and June 2020 are summarised in Table 2.22.
In this reporting period, both the monthly STG and ANI increased from April to June. The running quarterly STG slightly decreased from April to May and rebounded in June at a level higher than April, while the running quarterly ANI increased from April to June. No action Level for CWD monitoring was triggered during the reporting period.
Compared with the previous reporting period (i.e. January to March 2020), both the running quarterly STG and ANI increase, from 2.82 to 3.13 and from 9.17 to 13.86 respectively. While comparing with the same quarter of last year (i.e. April to June 2019), both the running quarterly STG and ANI increased, from 2.73 to 3.13 and from 10.54 to 13.86 respectively.
Table 2.22: Summary of Monthly and Running Quarterly STG and ANI of Chinese White Dolphin for the Same Quarter Last Year, Previous Quarter, and Current Reporting Period
|
|
Same Quarter of Last Year |
Previous Reporting Period |
Current Reporting Period |
||||||
|
|
Apr 19 |
May 19 |
Jun 19 |
Jan 20 |
Feb 20 |
Mar 20 |
Apr 20 |
May 20 |
Jun 20 |
|
Monthly STG |
2.86 |
2.33 |
3.02 |
2.89 |
3.13 |
2.42 |
1.58 |
2.12 |
5.86 |
|
Monthly ANI |
10.78 |
10.72 |
10.07 |
11.32 |
8.43 |
7.76 |
6.77 |
13.91 |
21.47 |
|
Running Quarterly STG |
2.10 |
2.37 |
2.73 |
2.65 |
2.86 |
2.82 |
2.36 |
2.03 |
3.13 |
|
Running Quarterly ANI |
7.47 |
9.80 |
10.54 |
7.86 |
8.89 |
9.17 |
7.63 |
9.45 |
13.86 |
Note: For detailed calculations of encounter rates STG and ANI for the current reporting period, please refer to the Construction Phase Monthly EM&A Report No. 52, 53 and 54.
Group Size
Between April and June 2020, the group size of CWD sightings ranged from 1 to 16 dolphins. The average group size of CWDs was 4.3 dolphins per group, which is larger than that of the last quarter (3.3 dolphins per group). The average group size of CWDs in this reporting quarter is also larger than that of the same quarter of last year (3.9 dolphins per group).
In this reporting quarter, the number of CWD sightings with medium group size (i.e. 3-9 dolphins) was slightly higher than that with small group size (i.e. 1-2 dolphins). There were four CWD sightings with large group size (i.e. 10 or more dolphins) recorded in this reporting period.
There were no distinct distribution patterns of small-sized and medium-sized CWD groups observed in the current reporting period, except that in SWL the medium-sized CWD groups tended to cluster at the coastal waters between Lantau and the Soko Islands. Sighting locations of CWD groups with different group sizes are depicted in Figure 2.6.
Figure 2.6: Sighting Locations of Chinese White Dolphins with Different Group Sizes
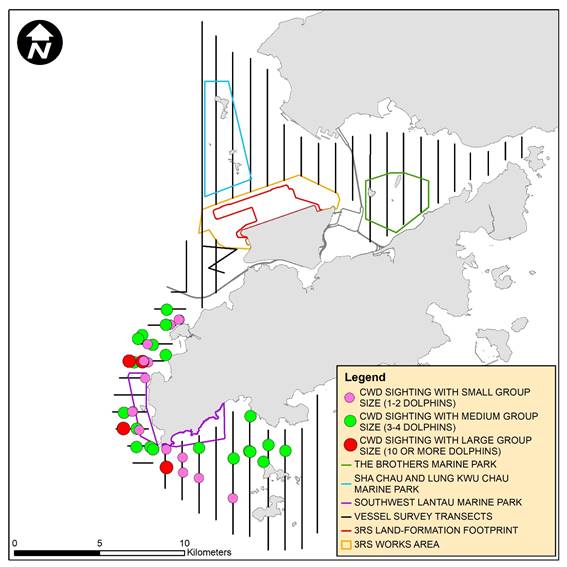
Remarks: (1) Please note that there are 41 circles on the map indicating the sighting locations of CWD. Some of them were very close to each other and therefore appear overlapped on this sighting distribution map. (2) Marine park excludes land area and the landward boundary generally follows the high water mark along the coastline.
Activities and Association with Fishing Boats
From April to June 2020, 11 sightings of CWDs were recorded with feeding activities. Amongst these sightings, two were observed in association with operating purse seiner, one was in association with pair trawler and another one was associated with gillnetter.
The number of sightings with feeding recorded in the current reporting period is higher than that in the previous reporting period (i.e. seven sightings involved feeding activities in which no sighting associated with fishing boat between January and March 2020). The number of CWD sightings with feeding activities is the same compared with the data in the same quarter of last year (i.e. 11 sightings between April and June 2019).
The sighting locations of CWDs engaged in different behaviours during the current reporting period are illustrated in Figure 2.7.
Figure 2.7: Sighting Locations of Chinese White Dolphins Engaged in Different Behaviours
Remarks: Marine park excludes land area and the landward boundary generally follows the high water mark along the coastline.
Mother-calf Pairs
From April to June 2020, seven sightings of CWDs were recorded with the presence of mother-and-unspotted juvenile, which is much more than that recorded in the previous reporting quarter (i.e. two sightings in January to March 2020) but slightly fewer than that recorded in the same quarter of last year (i.e. nine sightings in April to June 2019). All these sightings were recorded in WL except one recorded in SWL.
The locations of CWD sightings with the presence of mother-and-unspotted juvenile are shown in Figure 2.8.
Figure 2.8: Sighting Locations of Mother-calf Pairs
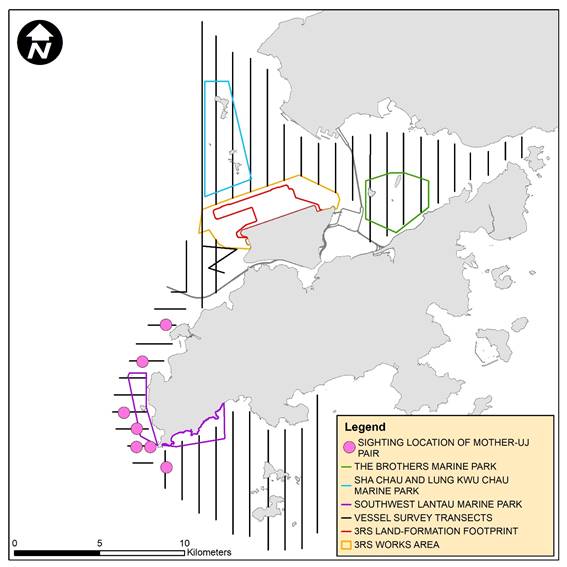
Remarks: Marine park excludes land area and the
landward boundary generally follows the high water mark along the coastline.
Photo Identification
During April to June 2020, a total number of 66 different CWD individuals were identified altogether for 115 times. Re-sighting information of CWD individuals provides an initial idea of their range use and apparent connection between different areas around Lantau. Amongst these 66 different CWD individuals, 34 animals (i.e. NLMM015, NLMM057, NLMM063, SLMM002, SLMM003, SLMM007, SLMM014, SLMM023, SLMM025, SLMM028, SLMM030, SLMM031, SLMM034, SLMM049, SLMM052, SLMM070, SLMM072, WLMM006, WLMM007, WLMM013, WLMM018, WLMM027, WLMM028, WLMM029, WLMM043, WLMM073, WLMM075, WLMM081, WLMM082, WLMM090, WLMM107, WLMM114, WLMM131 and WLMM150) were sighted for more than once.
Fourteen individuals including SLMM002, SLMM014, SLMM023, SLMM025, SLMM028, SLMM031, SLMM034, SLMM049, SLMM052, SLMM072, WLMM018, WLMM073, WLMM114 and WLMM131 were re-sighted in different survey areas during this reporting period. All cross-area movement were between WL and SWL survey areas. The most frequently re-sighted individual in this reporting quarter was WLMM114 which has been encountered altogether for six times. The number of CWD individuals re-sighted more than once and the number of CWD individuals showing cross-area movement in the current reporting period are both higher than those of the previous reporting quarter from January to March 2020 (19 and nine individuals respectively).
A summary of photo identification works is presented in Table 2.23. Representative photos of the 66 identified individuals and figures depicting the sighting locations of the aforementioned 34 re-sighted individuals recorded in this reporting period are presented Appendix C.
Table 2.23: Summary of Photo Identification
|
Individual ID |
Date of sighting |
Sighting Group No. |
Area |
|
Individual |
Date of sighting |
Sighting Group No. |
Area |
|
NLMM011 |
11-Jun-20 |
1 |
WL |
WLMM004 |
16-Jun-20 |
5 |
WL |
|
|
NLMM015 |
22-Jun-20 |
1 |
SWL |
WLMM005 |
07-May-20 |
3 |
WL |
|
|
2 |
SWL |
WLMM006 |
09-Apr-20 |
6 |
WL |
|||
|
NLMM043 |
16-Jun-20 |
1 |
WL |
07-May-20 |
3 |
WL |
||
|
NLMM055 |
11-Jun-20 |
5 |
WL |
WLMM007 |
09-Apr-20 |
6 |
WL |
|
|
NLMM057 |
09-Apr-20 |
1 |
WL |
07-May-20 |
3 |
WL |
||
|
3 |
WL |
13-May-20 |
3 |
WL |
||||
|
NLMM063 |
22-Jun-20 |
1 |
SWL |
WLMM009 |
07-May-20 |
2 |
WL |
|
|
2 |
SWL |
WLMM011 |
22-Jun-20 |
2 |
SWL |
|||
|
NLMM070 |
09-Apr-20 |
3 |
WL |
WLMM013 |
09-Apr-20 |
6 |
WL |
|
|
SLMM002 |
09-Apr-20 |
6 |
WL |
16-Jun-20 |
2 |
WL |
||
|
12-May-20 |
5 |
SWL |
WLMM015 |
16-Jun-20 |
4 |
WL |
||
|
13-May-20 |
1 |
WL |
WLMM018 |
13-May-20 |
3 |
WL |
||
|
3 |
WL |
22-Jun-20 |
4 |
SWL |
||||
|
SLMM003 |
07-May-20 |
3 |
WL |
WLMM027 |
07-May-20 |
1 |
WL |
|
|
13-May-20 |
3 |
WL |
13-May-20 |
3 |
WL |
|||
|
SLMM007 |
09-Apr-20 |
6 |
WL |
WLMM028 |
09-Apr-20 |
6 |
WL |
|
|
07-May-20 |
3 |
WL |
07-May-20 |
3 |
WL |
|||
|
SLMM010 |
11-May-20 |
4 |
SWL |
WLMM029 |
09-Apr-20 |
6 |
WL |
|
|
SLMM012 |
11-May-20 |
4 |
SWL |
07-May-20 |
3 |
WL |
||
|
SLMM014 |
09-Apr-20 |
6 |
WL |
WLMM030 |
16-Jun-20 |
2 |
WL |
|
|
11-May-20 |
4 |
SWL |
WLMM043 |
11-Jun-20 |
4 |
WL |
||
|
18-Jun-20 |
1 |
SWL |
7 |
WL |
||||
|
2 |
SWL |
WLMM056 |
09-Apr-20 |
1 |
WL |
|||
|
SLMM023 |
11-May-20 |
4 |
SWL |
WLMM060 |
09-Apr-20 |
1 |
WL |
|
|
13-May-20 |
1 |
WL |
WLMM062 |
16-Jun-20 |
2 |
WL |
||
|
3 |
WL |
WLMM070 |
11-May-20 |
4 |
SWL |
|||
|
SLMM025 |
11-May-20 |
4 |
SWL |
WLMM073 |
11-May-20 |
4 |
SWL |
|
|
16-Jun-20 |
5 |
WL |
13-May-20 |
3 |
WL |
|||
|
18-Jun-20 |
1 |
SWL |
22-Jun-20 |
4 |
SWL |
|||
|
SLMM028 |
09-Apr-20 |
6 |
WL |
WLMM075 |
09-Apr-20 |
1 |
WL |
|
|
16-Jun-20 |
5 |
WL |
3 |
WL |
||||
|
18-Jun-20 |
1 |
SWL |
WLMM081 |
07-May-20 |
3 |
WL |
||
|
SLMM030 |
07-May-20 |
3 |
WL |
16-Jun-20 |
4 |
WL |
||
|
13-May-20 |
4 |
WL |
WLMM082 |
07-May-20 |
3 |
WL |
||
|
SLMM031 |
09-Apr-20 |
6 |
WL |
16-Jun-20 |
4 |
WL |
||
|
12-May-20 |
5 |
SWL |
WLMM090 |
11-Jun-20 |
7 |
WL |
||
|
SLMM034 |
11-May-20 |
4 |
SWL |
16-Jun-20 |
5 |
WL |
||
|
13-May-20 |
1 |
WL |
WLMM107 |
11-Jun-20 |
5 |
WL |
||
|
|
3 |
WL |
6 |
WL |
||||
|
SLMM036 |
11-Jun-20 |
1 |
WL |
WLMM109 |
11-Jun-20 |
4 |
WL |
|
|
SLMM037 |
09-Apr-20 |
1 |
WL |
WLMM114 |
09-Apr-20 |
1 |
WL |
|
|
SLMM044 |
13-May-20 |
1 |
WL |
|
|
2 |
WL |
|
|
SLMM045 |
09-Apr-20 |
4 |
WL |
|
11-May-20 |
4 |
SWL |
|
|
SLMM049 |
13-May-20 |
3 |
WL |
|
13-May-20 |
1 |
WL |
|
|
18-Jun-20 |
2 |
SWL |
|
18-Jun-20 |
2 |
SWL |
||
|
SLMM050 |
09-Apr-20 |
6 |
WL |
|
22-Jun-20 |
6 |
SWL |
|
|
SLMM052 |
11-May-20 |
4 |
SWL |
WLMM131 |
15-Apr-20 |
1 |
WL |
|
|
13-May-20 |
3 |
WL |
|
13-May-20 |
3 |
WL |
||
|
SLMM058 |
09-Apr-20 |
6 |
WL |
|
18-Jun-20 |
2 |
SWL |
|
|
SLMM059 |
12-May-20 |
5 |
SWL |
WLMM138 |
07-May-20 |
3 |
WL |
|
|
SLMM068 |
12-May-20 |
5 |
SWL |
WLMM141 |
11-Jun-20 |
5 |
WL |
|
|
SLMM070 |
11-May-20 |
4 |
SWL |
WLMM142 |
11-Jun-20 |
4 |
WL |
|
|
22-Jun-20 |
3 |
SWL |
WLMM149 |
11-Jun-20 |
5 |
WL |
||
|
SLMM072 |
12-May-20 |
6 |
SWL |
WLMM150 |
07-May-20 |
3 |
WL |
|
|
13-May-20 |
3 |
WL |
|
13-May-20 |
3 |
WL |
||
|
WLMM001 |
07-May-20 |
3 |
WL |
WLMM153 |
16-Jun-20 |
2 |
WL |
|
|
WLMM003 |
11-Jun-20 |
7 |
WL |
|
|
|
|
2.5.2.2
Land-based Theodolite Tracking Survey
Survey Effort
During April to June 2020, a total of six days of land-based theodolite tracking survey effort were completed, including three days on Lung Kwu Chau and three days on Sha Chau. In total, five CWD groups were tracked from the Lung Kwu Chau station while no CWD groups were tracked from the Sha Chau station, with an overall 0.14 CWD groups sighted per survey hour.
Information on survey effort and CWD groups sighted during land-based theodolite tracking surveys are presented in Table 2.24. Details on the survey effort and CWD groups tracked are presented in Appendix C. The first sighting locations of CWD groups tracked between April and June 2020 are shown in Figure 2.9.
Table 2.24: Summary of Survey Effort and CWD Group of Land-based Theodolite Tracking Survey
|
Land-based Station |
# of Survey Sessions |
Survey Effort (hh:mm) |
# CWD Groups Sighted |
CWD Group Sighting per Survey Hour |
|
April 2020 |
||||
|
Lung Kwu Chau |
1 |
06:00 |
4 |
0.67 |
|
Sha Chau |
1 |
06:00 |
0 |
0 |
|
TOTAL |
2 |
12:00 |
4 |
0.33 |
|
May 2020 |
||||
|
Lung Kwu Chau |
1 |
06:00 |
1 |
0.17 |
|
Sha Chau |
1 |
06:00 |
0 |
0 |
|
TOTAL |
2 |
12:00 |
1 |
0.08 |
|
June 2020 |
||||
|
Lung Kwu Chau |
1 |
06:00 |
0 |
0 |
|
Sha Chau |
1 |
06:00 |
0 |
0 |
|
TOTAL |
2 |
12:00 |
0 |
0 |
|
OVERALL |
6 |
36:00 |
5 |
0.14 |
Figure 2.9: Plots of First Sightings of All CWD Groups from Land-based Stations
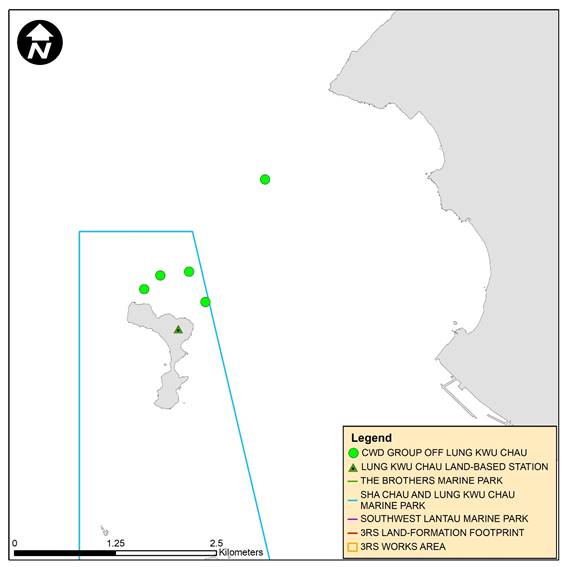
Remark: Marine park excludes land area and the landward boundary generally follows the high water mark along the coastline.
2.5.2.3
Progress Update
on PAM
An Ecological Acoustic Recorder (EAR) has been deployed and positioned to the south of Sha Chau Island inside the SCLKCMP (Figure 2.10) with 20% duty cycle, while data from the EAR intended primarily to supplement the data collected from the land-based theodolite tracking survey station on Sha Chau. In this reporting period, the EAR has been retrieved on 8 April and 27 May 2020 for data collection and subsequently redeployed. The EAR deployment is generally for 6 weeks prior to data retrieval for analysis. As the period of data collection and analysis takes more than four months, PAM results could not be reported in quarterly intervals but report for supplementing the annual CWD monitoring analysis.
2.5.2.4
Site Audit for
CWD-related Mitigation Measures
During the reporting period, silt curtains were in place by the contractors for marine filling works (similar to the previous reporting period), in which dolphin observers were deployed by each contractor in accordance with the Marine Mammal Watching Plan (MMWP). Teams of at least two dolphin observers were deployed at 2 to 6 dolphin observation stations by the contractors for continuous monitoring of the DEZ by all contractors for DCM works and seawall construction that were similar to the previous reporting period in accordance with the DEZ Plan. Trainings for the proposed dolphin observers on the implementation of MMWP and DEZ monitoring were provided by the ET prior to the aforementioned works, with a cumulative total of 694 individuals being trained and the training records were kept by the ET. From the contractors’ MMWP observation records and DEZ monitoring records, no dolphin or other marine mammals were observed within or around the silt curtains or the DEZ in this reporting period. The contractors’ records were also audited by the ET during site inspection.
Audits of acoustic decoupling for construction vessels were carried out during weekly site inspection and summarised in Section 2.6. Summary of audits of SkyPier HSFs route diversion and speed control and construction vessel management are presented in Section 2.7 and Section 2.8 respectively.
2.6
Environmental Site Inspection
Site inspections of the construction works were carried out on a weekly basis to monitor the implementation of proper environmental pollution control and mitigation measures for the Project. Bi-weekly site inspections were also conducted by the IEC. Besides, ad-hoc site inspections were conducted by ET and IEC if environmental problems were identified, or subsequent to receipt of an environmental complaint, or as part of the investigation work. These site inspections provided a direct means to reinforce the specified environmental protection requirements and pollution control measures in construction sites.
During site inspections, environmental situation, status of implementation of pollution control and mitigation measures were observed. Environmental documents and site records, including waste disposal record, maintenance record of environmental equipment, and relevant environmental permit and licences, were also checked on-site. Observations were recorded in the site inspection checklist and passed to the contractor together with the appropriate recommended mitigation measures where necessary in order to advise contractors on environmental improvement, awareness and on-site enhancement measures. The observations were made with reference to the following information during the site inspections:
· The EIA and EM&A requirements;
· Relevant environmental protection laws, guidelines, and practice notes;
· The EP conditions and other submissions under the EP;
· Monitoring results of EM&A programme;
· Works progress and programme;
· Proposal of individual works;
· Contract specifications on environmental protection; and
· Previous site inspection results.
Good site practices were implemented in the project to enhance environmental performance. Key examples are highlighted as below:
1. About 14,000 tonnes of inert C&D materials arising from the Horizontal Directional Drilling (HDD) works were reused as filling materials for the marine filling in the Project.
2. Rubble and asphalt collected from the demolition were reused for paving the haul roads of the construction area to reduce generation of fugitive dust during the movements of vehicles.
3. As part of the marine ecology and fisheries enhancement strategies, seawall blocks with eco-enhancement designs along the artificial vertical seawall has been installed to facilitate and promote colonisation of intertidal and sub-tidal fauna in the future.
|
|
|
|
|
Reuse of inert C&D materials as filling materials for the marine reclamation |
Reuse of rubble and asphalt generated from demolition for paving haul roads |
Seawall blocks with eco-enhancement designs along the artificial vertical seawall |


Besides, advices were given when necessary to ensure the construction workforce were familiar with relevant procedures, and to maintain good environmental performance on site. Regular toolbox talks on environmental issues were organised for the construction workforce by the contractors to ensure understanding and proper implementation of environmental protection and pollution control mitigation measures.
2.6.1
Landscape and Visual Mitigation Measures
Implementation of applicable landscape and visual mitigation measures (reference to the environmental protection measures CM1 – CM10 in Appendix B) as monitored regularly in accordance with the Manual. No non-conformity was recorded during the reporting period. Based on Contractors’ submitted records up to the end of this reporting period, a cumulative total of 228 and 8 trees were retained and transplanted. The Contractors’ performance on existing trees maintenance and protection measures on retained and transplanted trees were regularly checked by the ET. In case of non-conformity, specific recommendations would be made, and actions will be carried out according to the Event and Action Plan.
2.6.2
Land Contamination Assessment
The Supplementary CAP was submitted to EPD pursuant to EP Condition 2.20. The CAR for Golf Course and T2 Emergency Power Supply System No.1 (Volumes 1 and 2) were submitted to EPD in accordance with EP Condition 1.9 and the Supplementary CAP in which no land contamination issues were identified. The land contamination assessment work of the Emergency Power Supply System No. 3 is on-going in the reporting period.
A summary of implementation status of the environmental mitigation measures for the construction phase of the Project during the reporting period is provided in Appendix B.
2.7 Audit of SkyPier High Speed
Ferries
Due to the COVID-19 pandemic, all SkyPier HSF services have been suspended from 25 March 2020 until further notice. Special ferry service between Macau and Hong Kong International Airport was arranged from 17 June 2020 to 16 July 2020. In total, 56 ferry movements between HKIA SkyPier and Zhuhai / Macau were audited in the reporting period. The daily movements of all SkyPier HSFs in the reporting period ranged between 0 and 4, which fell within the maximum daily cap number of 125.
The average speeds of all HSFs travelling through the Speed Control Zone (SCZ) ranged from 9.9 to 13.3 knots. All HSFs travelled through the SCZ with average speed within 15 knots in compliance with the Marine Travel Routes and Management Plan for High Speed Ferries of SkyPier (the SkyPier Plan). The summary of the SkyPier Plan monitoring result is presented in Graph 1.
Insufficient AIS data cases were received from some HSFs during the reporting period. After investigation, it was found that AIS data for the concerned ferries were missing due to signal interference as reported by the ferry operators after checking the condition of the AIS transponders. Vessel captains were requested to provide the radar track photos which indicated the vessels entered the SCZ through the gate access points and there was no speeding in the SCZ. Ferry operators’ explanations were accepted.
Graph 1: Summary of SkyPier High Speed Ferries Monitoring Results
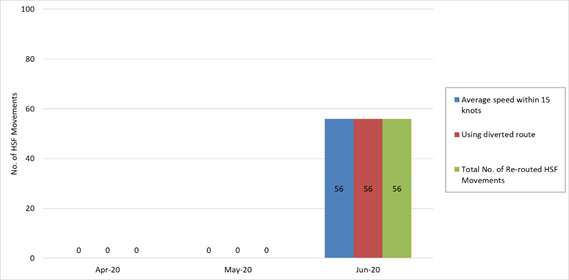
In addition, the dolphin habitat index was reviewed based on AFCD latest marine mammals monitoring report findings and historical dolphin density records, and the grids for dolphin hotspot remain unchanged. AAHK will continue to implement the SkyPier HSF route diversion and speed restriction according to the approved SkyPier Plan.
2.8
Audit of
Construction and Associated Vessels
On the implementation of the updated Marine Travel Routes and Management Plan for Construction and Associated Vessels (MTRMP-CAV), the Maritime Surveillance System (MSS) automatically recorded deviation cases such as speeding, entering no entry zone, and not traveling through the designated gates. ET conducted bi-weekly audit of relevant information including AIS data, vessel tracks and other relevant records to ensure sufficient information were provided by the system and the contractors complied with the requirements of the MTRMP-CAV. The contactors submitted 3-month rolling vessel plans for construction vessel activities to AAHK in order to help maintain the number of construction vessels to a practicable minimum. The IEC also performed audit on the compliance of the requirements as part of the EM&A programme.
During the reporting period, deviations including speeding within the works area, entry from non-designated gates, and entering no-entry zones were identified. After investigation by the contractor’s Marine Traffic Control Centre (MTCC) representatives, all the concerned captains were reminded to comply with the requirements of the MTRMP-CAV.
A total of 7 skipper training workshops were held by ET during the reporting period and 27 concerned captains of construction vessels associated with the 3RS contracts were trained to familiarise them with the predefined routes, general education on local cetaceans, guidelines for avoiding adverse water quality impact, the required environmental practices / measures while operating construction and associated vessels under the Project, and guidelines for operating vessels safely in the presence of CWDs. Another 29 skipper training workshops were held with 178 captains by contractors’ Environmental Officers and competency tests were conducted subsequently with the trained captains by ET.
2.9 Review of the Key Assumptions
Adopted in the EIA Report
With reference to Appendix E of the Manual, it is noted that the key assumptions adopted in approved EIA report for the construction phase are still valid and no major changes are involved. The environmental mitigation measures recommended in the approved EIA Report remain applicable and shall be implemented in undertaking construction works for the Project.
3
Report on Non-compliance,
Complaints, Notifications of Summons and Prosecutions
3.1
Compliance with Other Statutory Environmental Requirements
During the reporting period, environmental related licenses and permits required for the construction activities were checked. No non-compliance with environmental statutory requirements was recorded.
3.2
Analysis and Interpretation of Complaints, Notification of
Summons and Status of Prosecutions
3.2.1
Complaints
No construction activities-related complaint was received during the reporting period.
3.2.2
Notifications of
Summons or Status of Prosecution
No notification of summons nor prosecution was received during the reporting period.
3.3
Cumulative Statistics
Cumulative statistics on valid exceedance, non-compliance, complaints, notifications of summons and status of prosecutions are summarised in Table 3.1 and Table 3.2.
Table 3.1: Statistics for Valid Exceedances for the Environmental Monitoring
|
|
|
Total No. Recorded in the Reporting Period |
Total No. Recorded since the Project Commenced |
|
1-hr TSP |
Action Level |
0 |
0 |
|
|
Limit Level |
0 |
0 |
|
Noise |
Action Level |
0 |
0 |
|
|
Limit Level |
0 |
0 |
|
Waste |
Action Level |
0 |
0 |
|
|
Limit Level |
0 |
0 |
|
Water |
Action Level |
0 |
0 |
|
|
Limit Level |
0 |
0 |
|
CWD |
Action Level |
0 |
0 |
|
|
Limit Level |
0 |
0 |
Remark: Non-project related triggers of Action or Limit Level are not shown in this table.
Table 3.2: Statistics for Non-compliance, Complaints, Notifications of Summons and Prosecution
|
Reporting Period |
Cumulative Statistics |
|||
|
|
Non-compliance |
Complaints |
Notifications of Summons |
Prosecutions |
|
This reporting period |
0 |
0 |
0 |
0 |
|
From 28 December 2015 to end of the reporting period |
0 |
17 |
1 |
1 |
4 Conclusion and Recommendation
In this quarterly period from 1 April 2020 to 30 June 2020, the EM&A programme has been implemented as planned, including 96 sets of air quality measurements, 56 sets of construction noise measurements, 39 sets of water quality measurements, 6 complete sets of vessel line transect surveys and 6 days of land-based theodolite tracking survey effort for CWD monitoring, as well as environmental site inspections and waste monitoring for the Project’s construction works.
The key activities of the Project carried out in the reporting period included reclamation works and land-based works. Works in the reclamation areas included DCM works, marine filling, seawall and facilities construction, together with runway and associated works. Land-based works on existing airport island involved mainly airfield works, foundation and substructure work for Terminal 2 expansion, modification and tunnel work for APM and BHS, and preparation work for utilities, with activities include site establishment, site office construction, road and drainage works, cable ducting, demolition, piling, and excavation works.
Monitoring results of construction dust, construction noise, construction waste, and CWD did not trigger the corresponding Action and Limit Levels in the reporting period. All site observations made by the ET were recorded in the site inspection checklists and passed to the contractor together with the recommended follow-up actions.
For water quality, the water quality monitoring results for all parameters, except DO and SS, obtained during the reporting period were within the corresponding Action and Limit Levels stipulated in the EM&A programme. Relevant investigation and follow-up actions will be conducted according to the EM&A programme if the corresponding Action and Limit Levels are triggered. For DO and SS, some testing results triggered the relevant Action or Limit Levels, and the corresponding investigations were conducted accordingly. The investigation findings concluded that the cases were not related to the Project. To conclude, the construction activities in the reporting period did not introduce adverse impact to all water quality sensitive receivers.
In total, 56 ferry movements between HKIA SkyPier and Zhuhai / Macau were audited in the reporting period. All HSFs travelled through the SCZ with average speed within 15 knots in compliance with the SkyPier Plan.
During the reporting period, ET conducted bi-weekly audit of the MSS to ensure the system recorded all deviation cases accurately and the contractors fully complied with the requirements of the MTRMP-CAV. Seven skipper training workshops were held by ET and 29 skipper training workshops were held by contractors’ Environmental Officers during the reporting period and competency tests were conducted subsequently with the trained skippers by ET.
On the implementation of MMWP, dolphin observers were deployed by the contractors for laying of silt curtains for marine filling works in accordance with the plan. On the implementation of DEZ Plan, dolphin observers were deployed for continuous monitoring of the DEZ by the contractors for DCM works and seawall construction in accordance with the DEZ Plan. Trainings for the proposed dolphin observers were provided by the ET prior to the aforementioned works. From the contractors’ MMWP observation records and DEZ monitoring records, no dolphin or other marine mammals were observed within or around the silt curtains or the DEZ in this reporting period. Audits of acoustic decoupling for construction vessels were also carried out by the ET.
The recommended environmental mitigation measures, as included in the EM&A programme, were effectively implemented during the reporting period. Also, the EM&A programme implemented by the ET has effectively monitored the construction activities and ensured the proper implementation of mitigation measures.
[1] The Manual is available on the Project’s dedicated website (accessible at: http://env.threerunwaysystem.com/en/index.html)